Permaculture Plan part 2
Last week I wrote about all the maps needed for my Permaculture Design Certificate but they were only about 2/3 of the maps needed, so this week it is the final maps with the actual plan on it.
Having decided where the water, access and structures are you are left with some space to fit in the things that you want.
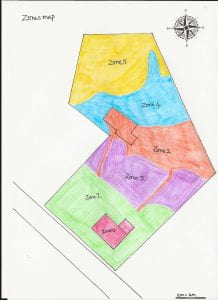 The next map is a Zone map. Permaculture works in zones with zone 0 being the house and centre of activities working outwards towards zone 5. The zones are about how often you visit the area so zone 0 multiple times a day but zone 4 you might only visit once or twice a year where the area is virtually self-managing. For example, there is a large walnut tree in the garden which does not need any maintenance other than harvesting the nuts making it a zone 4 area in this location.
As you can see from my map the zones do not have to go out in concentric circles as shown in the diagram probably because real life is not that neat!
I have to admit to drawing this map after I had completed my final plan for the garden. I am not quite sure how you can do it before hand.
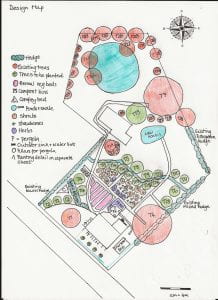 And finally, we get to the plan itself. At this point you can definitely say that you know this plot of land well and so placing of the elements that you want is quite easy.
There is a small food forest planted around the swale with fruit trees, bushes and shrubs, some permanent vegetables and spreading herbs. In front of this, in pink, are the annual vegetable beds in straight lines so that they can be easily covered over winter. There is a windbreak hedge in front of the veg beds and then willows in front of that to soak up as much water as possible before it leaves the property.
In front of the house are 4 apricot trees placed to soak up the sunshine.
 Not all of the plants can be identified on this plan, they are just too small to show so there are some planting plans to go alongside it.
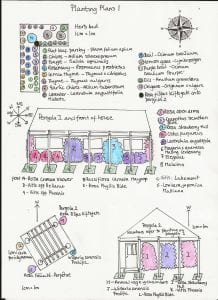
The first set of planting plans shows the herb bed around the pergola and the pergolas around the house. Plants have been identified on the plan so that everything can be seen at a quick glance.
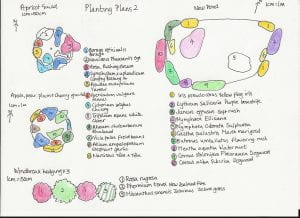 The second planting plan shows the pond, the windbreak hedge and the tree guilds, again with plants identified on them. Each diagram has its own compass and also has its own scale identified because they vary.
What I did feel at this point was that it was important to be quite specific about the plants, I didn’t want to come back to it again later, and it was a requirement that we provide the latin name. If you just list a walnut tree, a black walnut will have a very different impact on your planting plans to an English walnut. (Black walnuts have a substance juglone which they release in the soil and which kills some other fruit trees off such as apple, pear and plum.)
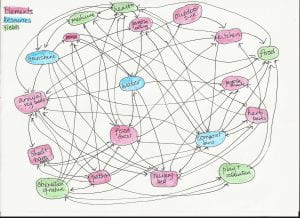 I also created a connections map because there are several concepts in permaculture such as each element having more than one function, using niches, stacking functions, use of edges and many others. I probably should have included this in my submission because the feedback was that I was a bit light on connections in my description of my plan. Below, I list an example of some of the concepts:
Elements having more than one function: Grass paths through the forest garden
- somewhere to walk with out damaging the planting
- can be mown and the grass be used as a mulch or incorporated into the compost which will then be used as a mulch
- act as barriers if a lot of water flows down out of the swale and would be able to hold a couple of inches back as they are set higher than the soil
- define the growing area
- prevent the spreading plants such as mint from taking over
Stacking functions: Outdoor sink
- the water used in the sink is rain water collected from the back half of the house roof
- runs down the plughole into a bucket underneath
- used to water vegetables
- veg picked and need to be washed and so we go round again
Use of edges:
Edges are some of the most valuable parts because they are the meeting space between two places and therefore benefit from both but also create a third space of their own
- the edge of the pond and the land for growing plants for food, habitat, keeping the water clean and aesthetic reasons
- the edge of a forest where there is more sunshine and so is suitable for fruit bushes and shrubs
- the edge of a hard surface such as paving where water runoff can be used by the plants
I have to say that this whole process took hours and of course, if you make a mistake with hand drawn maps you have to draw them again. I did use Tipex on several occasions. So, I have started to learn how to use Inkscape as it seems that many people use it to create their plans. I have managed the first three maps so far!
Have you ever drawn plans or do you create as you go along?
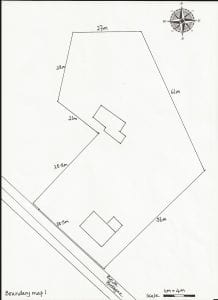 The first plan is a boundary map showing only the outlines of the land with no detail so that there is nothing to detract from clearly seeing the shape and area. It states the space you have to work and ensures there is no confusion.
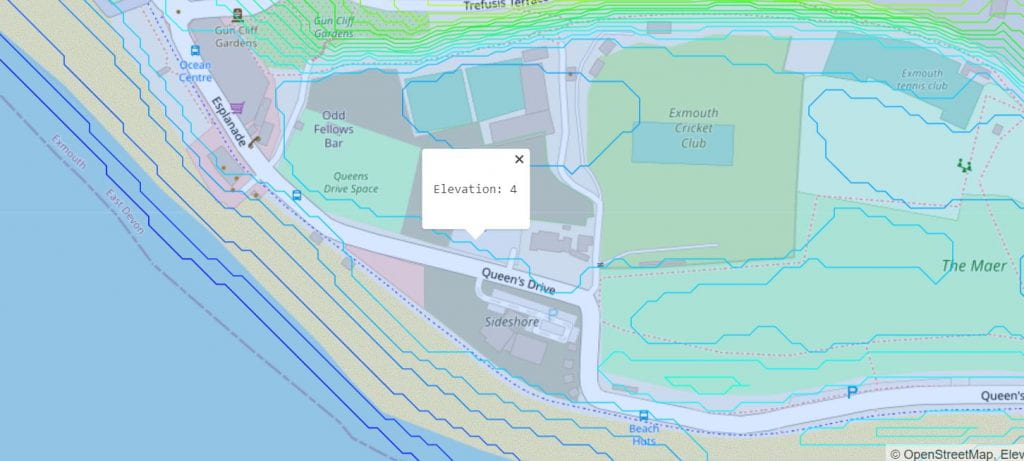
 Next was the contour map showing the slope of the land. Although this garden felt fairly flat, there was one contour line running through it at 108m. Feedback suggested that one contour line is not enough on a map because it does not show in which direction the land slopes and therefore how water would flow. There are two things I could do here. I could show 107m and 109m both of which are off the property or I could have looked to see if there were any contours at 0.5m intervals on the land and I will go back and consider both of these and which would be more useful.
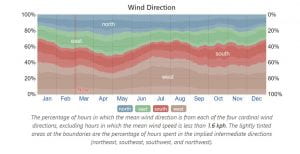
 Then there is the sector map. On this we map the sun’s pathway in mid winter and summer (red sectors), prevailing winds and other winds that affect the place plus things like views to be kept. We also map negative things such as noise, views we don’t want or anything else we want to block out in the design. This will have an impact on what we place and where. Different colours for each sector are used and most focus around the house because that is the centre of action. The sector at the top affects the barn which is why it is placed up there rather than around the house.
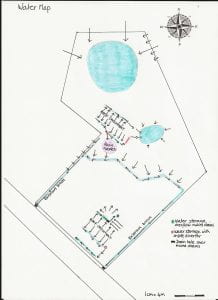 Without water there is no life so the water map in Permaculture is extremely important. What we are aiming for here is to hold water on the land for as long as possible, preferably where we need it. The saying is ‘slow it, spread it and sink it’ and some add store it to that list. This property is not storing potable water, just water for the gardens but many properties where water is scarce or expensive will have systems planned into the design to do so. This map links up with the contour map because swales, tree growing systems that slow water down, are built on contour. The feedback on this map was that the water flow was not clear although I did show it on another map. I just needed an arrow from the pond at the top of the garden to the next pond and one from the pond to the swale to enable everyone to see the flow of water through the land.
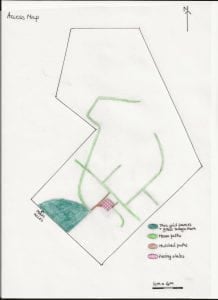 Next is the access map and again this features access to the land, paths, tracks, drives, roads etc that are existing and staying and new additions. This gives us a chance to consider whether the driveway is on the boggiest piece of land or how we will access all parts of the land.
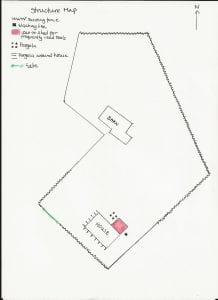 Following this is the structure map which shows fences, buildings, outbuildings, pergolas or anything which is a structure that you want to include in the design. My addition to the structures are two pergolas; one on the southwest and west sides of the house to provide shade in the summer and one at the back of the house to provide a place to sit out and eat. The pergola around the house is designed to allow the sun in during the winter months but prevent it from hitting the house during the summer. This will have an effect on the temperature inside the house.
 The last of the maps in this section (hooray!) is the W.A.S map or water, access and structure map where all three are combined but with the emphasis on where they intersect. This means that you don’t have to show everything but it is important to show things such as where the paths and water meet and cross because this will need to be designed for using things such as crossing pipes to take the water in that area.
 The first one is for passing my Permaculture Design course which I started in February and finished this month (November). I have taken part in quite a few online courses, including writing one, and this one, Geoff Lawton Permaculture Design Course online, was excellent. The course has Teaching Assistants who patiently answer every single question asked and obviously have extensive permaculture experience themselves.
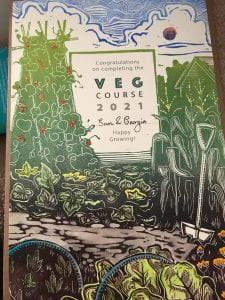 My second certificate was from the Vegetable Growing Course that we run on the allotments. John leads it but there are three of us that help, you could call us teaching assistants (!) and one of the course members has a daughter who is incredibly creative and made us certificates for a graduation ceremony. They are lino prints and absolutely fantastic. We started the course the second week of February and finished at the end of October, sowing, growing and harvesting together working in a no-dig way. The best thing about the course was getting to know the group and now that they all have their own allotments we are still a community but part of a much wider one. Our next activity is in December where John is hosting two sessions for us to make Christmas wreaths.
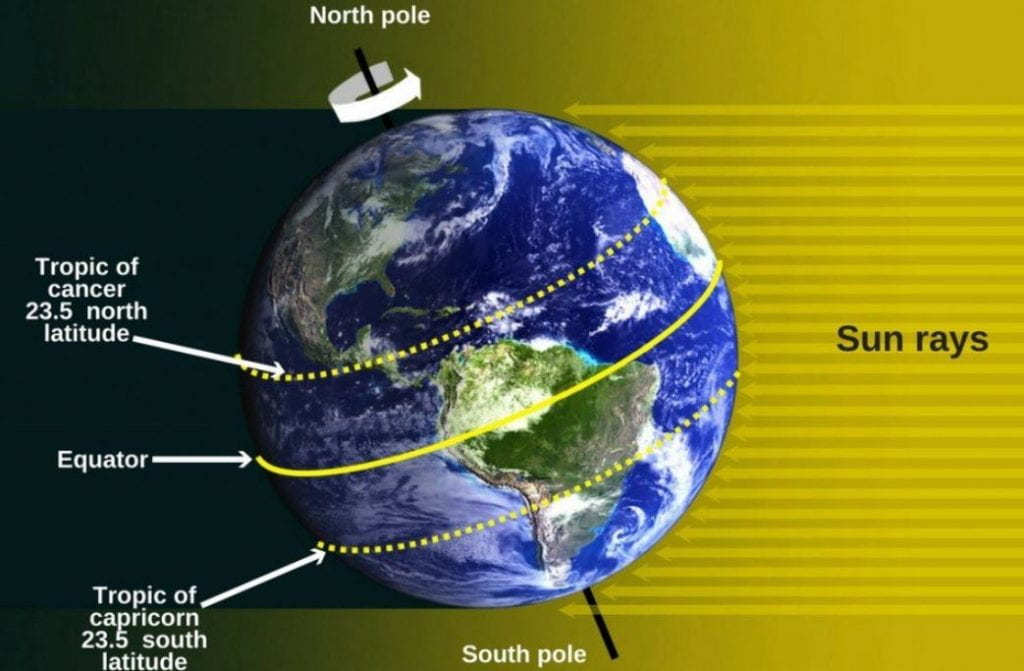 The nearer to the equator the the more sun because the sun hits the equator more directly and in a more concentrated manor. The earth is tilted 23.5 degrees on its axis and this means that for half the year the north is tilted towards the sun and then away from the sun (and vice versa for the south) so the rays hit the earth at a different angle and intensity than they do at the equator. The latitude of the equator is 0° and for the Britain 50° (Cornwall) to 60° (Shetland Isles). Exmouth is 50.6°N.
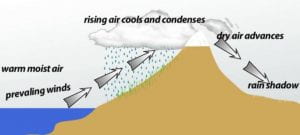 Topography is how the geography of the place affects the weather and ultimately the climate. Hills or mountains can create rain and the weather can be different on the windward or leeward side. There can be a funneling of winds due to the shape of the land and a large body of water such as a lake or reservoir can also create milder temperatures.
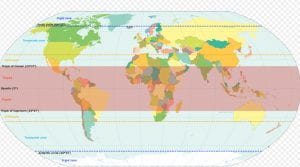 The nearest place to Exmouth with a different climate is Gran Canaria which has a sub tropical climate with hot summers and mild winters and is a place many people from the UK visit in the winter.
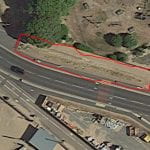
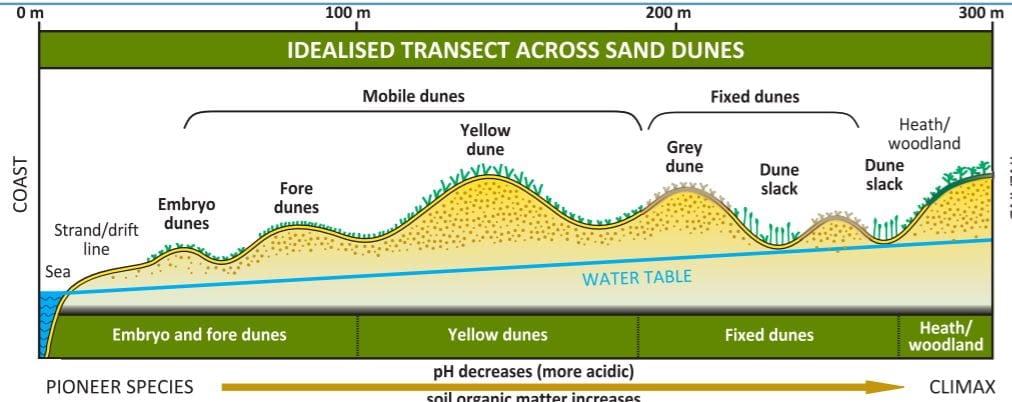
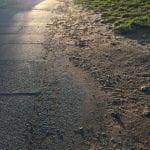
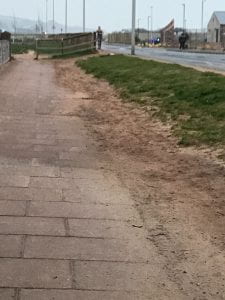
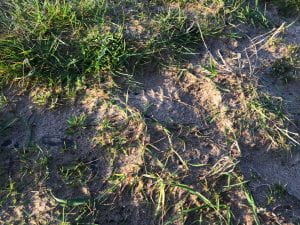 In order for sand dunes to be made, you need two media, sand and wind, where the wind blows sand, deposits it and then blows it away again. In geographic terms, deposition and erosion. Whilst the dunes behind the beach are quite stable, this piece of land has mini dunes on it. The wind blows the sand which gets trapped by the grass on the land and is then eventually blown off, hitting the wall opposite it and deposited at the base of the wall. The ripples in the sand come from the patterns on the base of trainers rather than anything nature has created. Although hard to see, the pattern is again a wave pattern.
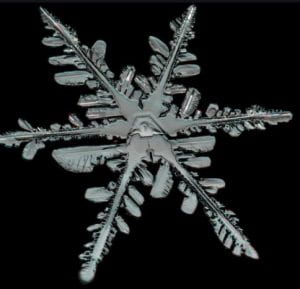
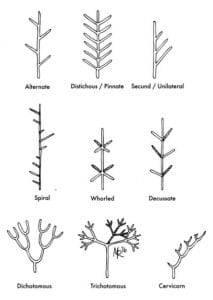
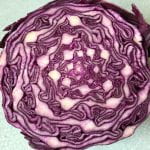
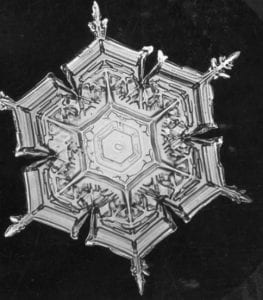 In nature there are a limited number of patterns but an infinite number of variations. Take a snowflake: there are no two snowflakes that are the same although they are all formed in a similar way.

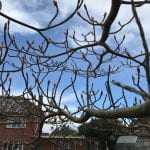
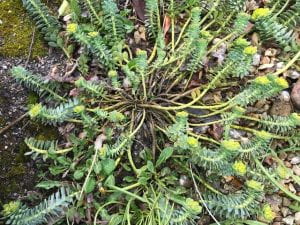
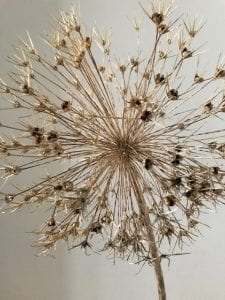 This explosion, however, is the dried flower of Allium x ‘Globemaster’ with some seeds left in the seedheads. The flowerhead is made up of hundreds of little flowers in a beautiful purple during late May early June. It is an excellent example of a pattern within a pattern within a pattern because it is an explosion making a sphere with some branching at the end of each individual flowerhead. You get a really clear picture of how the seeds are dispersed all around the plant, some near and some slightly further away.
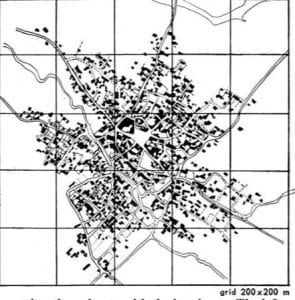
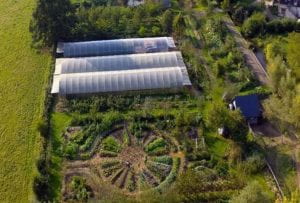 So, how can we use this pattern in design? This is an image of La Ferme du Bec Hellouin in Normandy, France. Below the polytunnels can clearly be seen an exploding pattern set of beds all coming off a central point. Often in walled gardens there would be a well or water store in the centre of this type of pattern, making it quicker and easier to water the beds – or nowadays a tap on a standpipe from a gravity-fed reservoir on higher land.
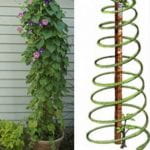

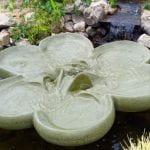 A vortex is a spiral where the air or water swirls around and anything caught in the motion is pulled into the centre. One place where this can be used in the garden is in free flow water features to aerate the water. They are based on an idea from Rudolf Steiner and shown through
  A book I have bought to read as a result of this module on patterns in nature is
 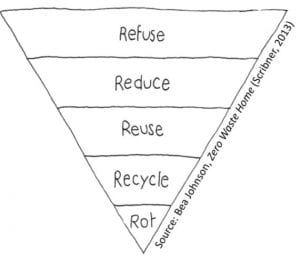 Whatever we take, we must return.
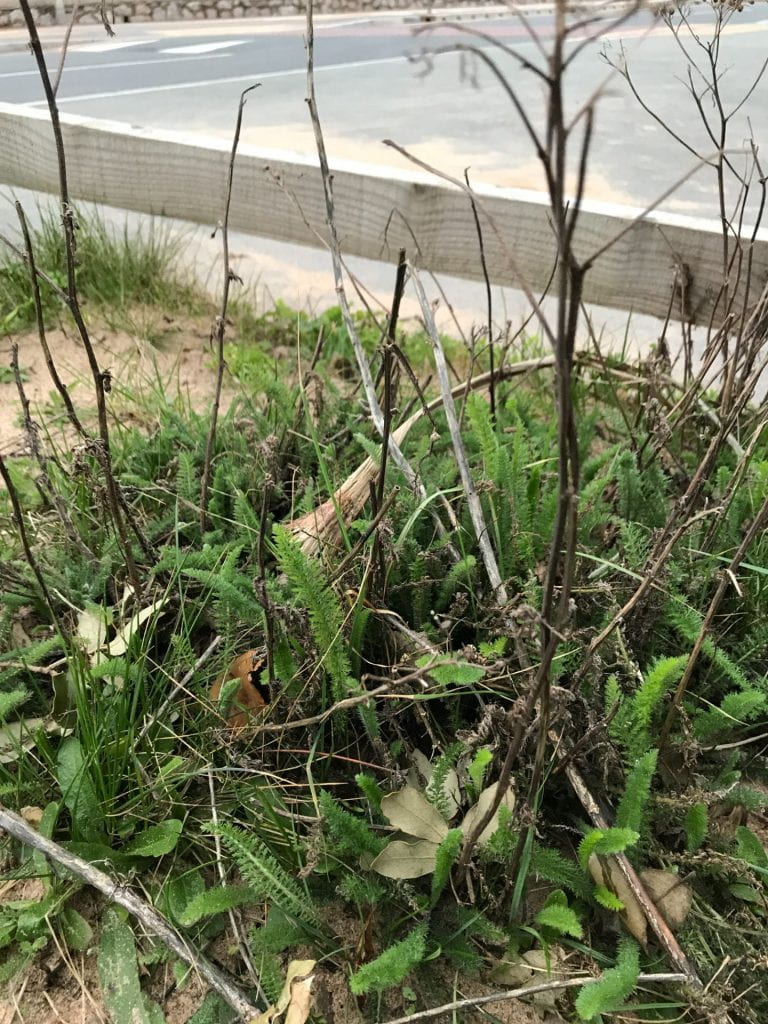

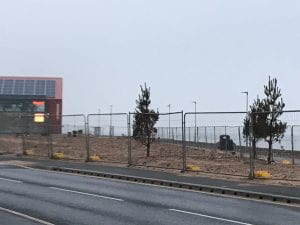
 It is still behind the buildings but at the edge and probably is just not protected enough.
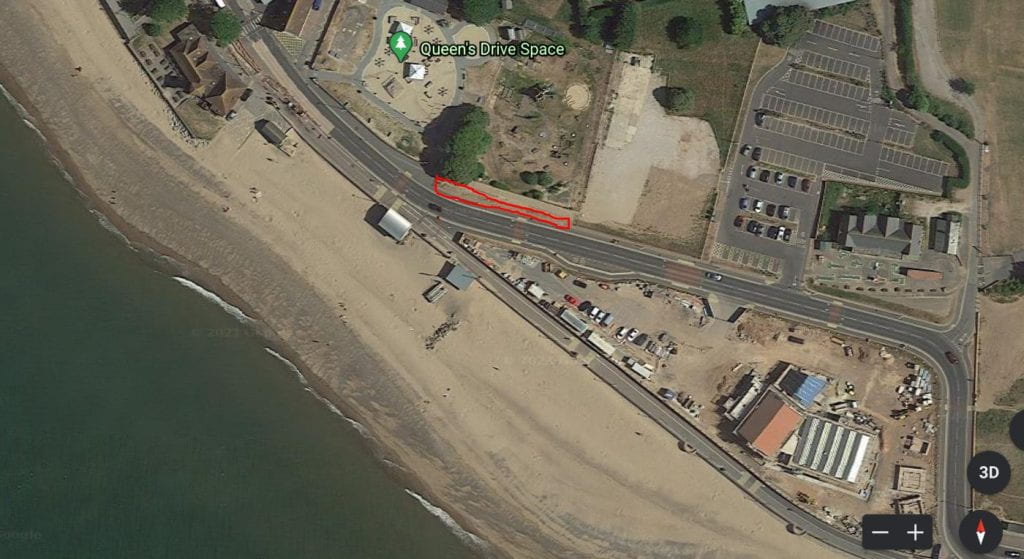
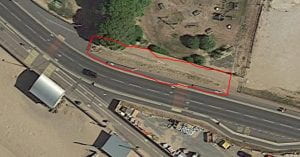
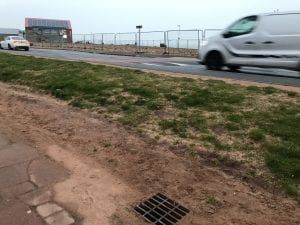
 The land is quite steeply sloped down to the pavement and the pavement has a slight slope towards the land. What this means is that when it rains, a large puddle builds up because the one and only drain fills up with sand over time. I am also pretty sure that the drain leads straight through to the beach and the water is not spread throughout the patch of land ready to be used by the plants that are there.
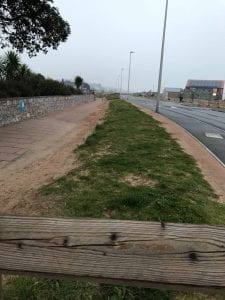

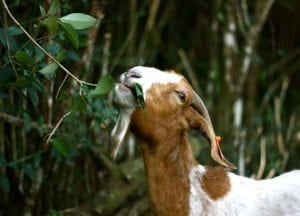 Everything gardens. This concept raised one of the larger, more animated discussions. If you observe nature closely, and that is what we have to do on our own land, we are not the only things that prune, cut grass or dig. Sheep, cows, horses etc will mow the grass and other vegetation, goats will prune small trees and shrubs, chickens and ducks will find and dispatch pests and rabbits will dig. But what these all also do is provide manure which can be composted and returned to the land. If we recognise this, we can make the land more productive and integrate animals into the systems to work for us. Of course, the animals add more than just manure. They add food, company, hard work, pleasure if we design their natural behaviours so that it benefits all. In fact, many permaculture farms include animals and I can see how this is of benefit. With three allotments, I struggle to create enough compost to mulch all of the beds because I have no animal manure to use. I have to buy it in. If there were chickens, their bedding could be used which would increase the amount of material to compost and the composition of the compost. There are many people farmers who understand that animals are a key part of soil regeneration such as
 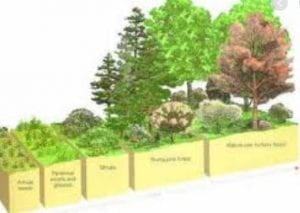 Stability is where a system self-regulates and where our intervention can increase yields where there is constant feedback and readjustment. We can intervene with a nutrient response, introduce fire (hmmm!) or prune to let more light in. Stability is also created through the connections between elements, e.g. growing corn, squash and beans together where all benefit from each other. This