Permaculture Plan part 1
I thought I would share the plan I submitted for my final design exercise plus some of the writing that goes alongside it to explain.
Before you start anything you need to gather information about the plot, weather, climate, land and what is already there and this involves A LOT of maps and if you can’t do them electronically, you have to hand draw them. I did draw them by hand because it would have taken me so long to learn a new piece of software that I thought it would detract from the space in my brain to think permaculture thoughts!
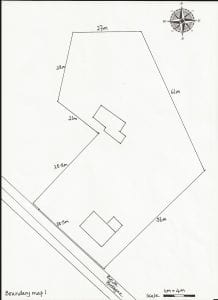 The first plan is a boundary map showing only the outlines of the land with no detail so that there is nothing to detract from clearly seeing the shape and area. It states the space you have to work and ensures there is no confusion.
It needs to include a compass so that directions can be easily seen plus scale and I have included the road and buildings. This map became my base map and is one that I traced or photocopied to use for all other maps minus the boundary lengths. To get this map I used google maps and a data projector and traced the land on a piece of paper stuck on the wall.
 Next was the contour map showing the slope of the land. Although this garden felt fairly flat, there was one contour line running through it at 108m. Feedback suggested that one contour line is not enough on a map because it does not show in which direction the land slopes and therefore how water would flow. There are two things I could do here. I could show 107m and 109m both of which are off the property or I could have looked to see if there were any contours at 0.5m intervals on the land and I will go back and consider both of these and which would be more useful.
 Then there is the sector map. On this we map the sun’s pathway in mid winter and summer (red sectors), prevailing winds and other winds that affect the place plus things like views to be kept. We also map negative things such as noise, views we don’t want or anything else we want to block out in the design. This will have an impact on what we place and where. Different colours for each sector are used and most focus around the house because that is the centre of action. The sector at the top affects the barn which is why it is placed up there rather than around the house.
The small diagram at the bottom of the map shows the angle of the sun, important if you want to block out the sun in mid summer and allow it in in the winter. This map enabled me to see clearly where a windbreak hedge needs to be placed for the prevailing winds (dark blue) and the cold north easterly winds (light blue) in winter.
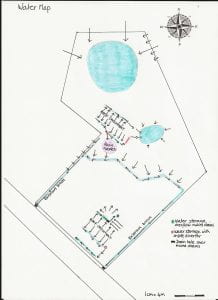 Without water there is no life so the water map in Permaculture is extremely important. What we are aiming for here is to hold water on the land for as long as possible, preferably where we need it. The saying is ‘slow it, spread it and sink it’ and some add store it to that list. This property is not storing potable water, just water for the gardens but many properties where water is scarce or expensive will have systems planned into the design to do so. This map links up with the contour map because swales, tree growing systems that slow water down, are built on contour. The feedback on this map was that the water flow was not clear although I did show it on another map. I just needed an arrow from the pond at the top of the garden to the next pond and one from the pond to the swale to enable everyone to see the flow of water through the land.
This is the first map that shows design elements, elements that are not already present on the land. There is a second mini swale at the front of the house to water some trees that will be planted there but this is not on a contour line and will be fed from the front half of the house roof.
For this map we also calculate run off and overflow of water for a ‘once in a hundred years’ rainfall imagining that the land is 100% saturated so that we have no disasters with large bodies of water flowing across the land. For each element of water, pond, swale, rain garden and ditch the amount of water that will fall must be calculated and a spillway built into the system to allow it to overflow across the land. So, as you go down the land the spillways get bigger and bigger as the catchment area grows. I have over sized all of the spillways because these once in a hundred year events are happening more frequently now.
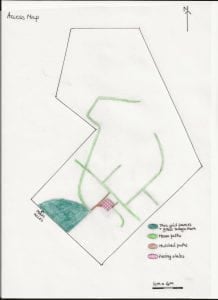 Next is the access map and again this features access to the land, paths, tracks, drives, roads etc that are existing and staying and new additions. This gives us a chance to consider whether the driveway is on the boggiest piece of land or how we will access all parts of the land.
Once again, I have removed all extraneous pieces of information so that the access is really clear. To create this map, I used tracing paper over the boundary map to get paths, driveway and paving in the right place and to show how they are all connected. The paths are 1.2m wide to allow space for a person and a wheelbarrow.
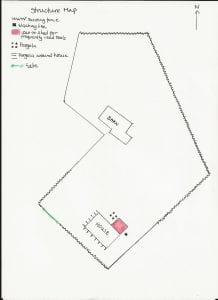 Following this is the structure map which shows fences, buildings, outbuildings, pergolas or anything which is a structure that you want to include in the design. My addition to the structures are two pergolas; one on the southwest and west sides of the house to provide shade in the summer and one at the back of the house to provide a place to sit out and eat. The pergola around the house is designed to allow the sun in during the winter months but prevent it from hitting the house during the summer. This will have an effect on the temperature inside the house.
Some designs will include building a house or siting a shed, greenhouse or polytunnel. Mine is quite minimal in this area.
 The last of the maps in this section (hooray!) is the W.A.S map or water, access and structure map where all three are combined but with the emphasis on where they intersect. This means that you don’t have to show everything but it is important to show things such as where the paths and water meet and cross because this will need to be designed for using things such as crossing pipes to take the water in that area.
The red blobs are crossing areas for swale and paths and the dark blue blob is where possible overflow and path meet.
You can also see on this map the two blue arrows showing the flow of water from pond to pond which I should have included on the water map.
Once you have this map it becomes much easier to place your other elements. Trees must go along the swale, the annual vegetable garden needs to go in a sunny, easily accessible place, a place to play and pitch tents becomes more obvious and so the final design can be created.
I’ll show you the maps for that in another post. You may well be mapped out by now!